Fluoridated water, with lead-contaminated fluoride,
is also capable of leaching more lead from water pipes and fittings.

Lead is poison, a potent neurotoxin whose sickening and deadly effects
have been known for nearly 3,000 years and written about by historical
figures from the Greek poet and physician Nikander and the Roman
architect Vitruvius to Benjamin Franklin. Odorless, colorless and
tasteless,
lead can be detected only through chemical analysis.
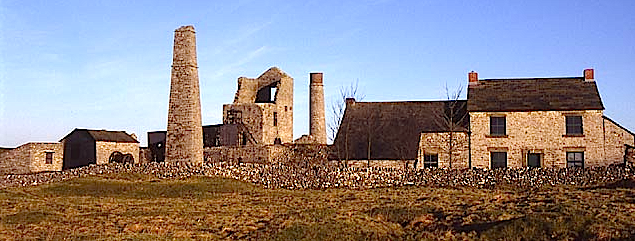
AFS F:lead ff

Lead-Mine-wide-

 An Old Lead Mine

Silicofluorides contain more lead than sodium fluoride. 
Compared with NaF, SiFs cause more lead to be leached from
brass pipe and fittings and from the lead solder used to solder 
copper pipe and cast iron water mains. For all these reasons
SiFs should be disallowed as fluoridation materials.

Pb-divider-ss-300x14

 Lead in Aviation Fuel +

Pb-divider-ss-300x14


Fluoride-Lead-s

Original  HERE 

HeadingF.-Lead-by-F.-Frech

The fluosilicates are the by-products of the phosphate fertilizer industry.
In the manufacture of this kind of fertilizer, phosphorus is obtained from phosphate rock,
which has to be broken down with sulfuric acid.

(1) Fluorine occurs naturally in combination with the phosphates.

(2) In these two facts lie the keys to the presence of lead in the fluosilicates.

Step One: Sulfuric acid is prepared by either of two ways, the lead chamber process

(3) or the contact method.

(4) In its purest form (made by the contact method) it is used in pharmaceuticals; in its lowest grade (produced by the lead chamber process) it is used by the fertilizer industry.

(5) It is also frequently recovered for re-use, but this form is too impure for any purpose except the manufacture of fertilizer, for which it is quite suitable.

(6) In the lead chamber process purification is carried out only to the extent of removing substances that could clog the machinery.

(7) Of the common metals, only lead is resistant to cold sulfuric acid in concentrations up to 100%. But in hot acid the resistance is up to about 70%.

(8) The lead chamber type uses heat (about 600 C) and isn’t cooled during the process. That’s why a certain amount of lead is leached during this procedure.

If a pure product is needed, the contact method is used, but it’s more expensive, more complicated. In the making of fertilizer, however, a pure grade is not necessary. After all, neither fertilizer nor its by-products were intended for human consumption.

Step Two: Fluorine, which is a highly reactive element capable of joining with any other element except oxygen, is able to leach lead from the contaminated sulfuric acid. In the past hydrofluosilicic acid was simply neutralized and discarded. The picking up of lead wouldn’t have been a problem. But eventually it was decided that the acid, being already in solution, would be better, simpler to use, and less expensive than sodium fluoride.

(9) The lead contamination, apparently, was forgotten (if, indeed, it had ever been noticed.)

Sodium fluoride is also lead-tainted (and with arsenic, as well.) Aluminum ore (bauxite) is usually contaminated with lead and arsenic (and a number of other elements.) In order to obtain a pure product, these have to be removed.

(10) They become part of the major by-product of aluminum refining, sodium fluoride.

Another way in which fluoridation contributes to lead in the water is through its action on whatever lead pipes may still be in existence in older homes. Any lead pipes would be old lead. These are ordinarily covered by a protective coating made by the lead itself which is impervious to diluted acids (as all of them would be in water.) Water acts slowly on lead, forming lead hydroxide, but the action is slight if the water contains carbon dioxide or carbonates or sulfates which interact with lead to form these protective coatings.

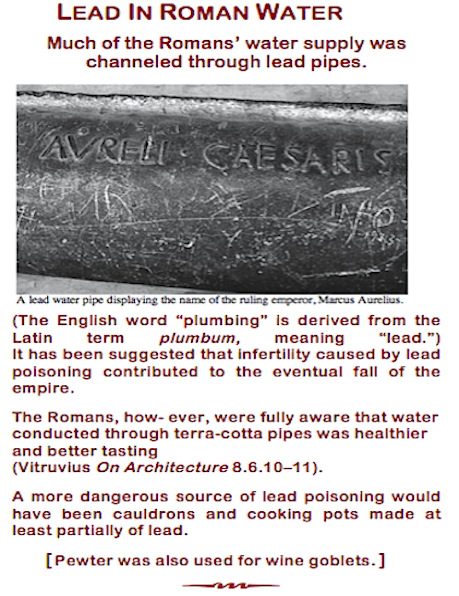
(11) It’s interesting that the lead pipes in Roman aqueducts, 2000 years old, are still in such good shape the numbers and letters engraved on them are clearly legible.

(12) In fluoridated water, though, it’s a different matter. Fluorine can and does destroy the protective coatings; it can and does leach lead. – A paediatric textbook published in 1964

(13) noted that the incidence of lead poisoning had been rising in certain metropolitan areas in Eastern United States. The blame was laid on old lead paint flaking from walls and woodwork. But most of the lead chips were old before 1964; some children chewed them long before then. But a new source of lead had arisen–unnoticed: The fluoridation of water, with lead-contaminated fluoride, a substance also capable of leaching lead from the pipes. Although there were scattered places fluoridating throughout the nation, larger numbers of eastern metropolitan communities were doing so.

Today one in nine children under the age of six is said to have unacceptably high blood lead levels

(14) even though lead paint was banned in 1978 (and hadn’t been used extensively since the 1950’s!) Lead in gasoline has been phased out, and lead solder hasn’t been permitted on copper tubing since 1986 (eight years ago.) The EPA says that lead stabilizes in five years. So except for fluoride use, any pipes, whether of lead or lead-soldered, should not now be hazardous. The most revealing statistics, though, are the high blood lead levels in 400,000 newborns each year. Newsweek in its article on lead and the threat to children

(15) said that pregnant women passed this toxic substance to their unborn children by eating, drinking, or breathing it. But even though pregnant women do sometimes have weird cravings, it’s not likely more than a tiny percentage would be chewing paint chips, nor would a significant number of them be engaged in renovating old houses. The lead is in the water–and in foods and beverages prepared with the water.

The EPA estimates that 10-20% of the lead in children comes from the drinking water.

(16) That agency, which knows of the lead contamination of fluoride products, insists the amount is too small to be of regulatory concern. What they have overlooked, though, is that it concentrates in the body tissues, and over time, would add up to quite a lot. In addition, it becomes concentrated in products processed with the water. The 10-20% directly from the water can easily become three or four times as much.

The EPA lists as health problems caused by lead the following conditions: Interference with formation of red blood cells, anemia, kidney damage, impaired reproductive function, interference with Vitamin D metabolism, impaired cognitive performance, delayed neurological and physical development, elevations in blood pressure.

(17) The agency also suggests lead my be a carcinogen, possibly causing kidney tumors and lymphocytic leukemia.

(18) Furthermore, it’s a known scientific fact that lead poisons the bone marrow.

(19) Surely, then, it would be prudent to avoid even “a little bit of lead,” assuming that’s all fluoridation contributes.

But the evidence shows it’s much more than that. Let us tell you a tale of two cities–Tacoma, Washington, and Thurmont, Maryland. Both of them saw significant decline in lead levels only six months after fluoridation was stopped. (In Tacoma, that was due to equipment problems, in Thurmont, it was a temporary ban by the city council.) Tacoma registered a drop of nearly 50%

(20)  in Thurmont it was 78%.

(21) To the best of our knowledge, no other explanations were offered. In Thurmont the ban is now permanent.

(22) In Tacoma, we’re told, a battle continues over whether or not to resume fluoridating.

We have more points to add. As we’ve already mentioned, the EPA says that lead may be implicated in causing leukemia. A booklet published by the Leukemia Society in 1987 noted that chemicals which damage the bone marrow can cause leukemia. The Book of Popular Science, 1974, pointed out that bone marrow is poisoned by lead.  [link added by us]

(23) Are we to believe, then, nothing is wrong with putting a little bit of lead into the water (from which it will also enter, more concentrated, food and beverages prepared with the water?)

The EPA permits lead-contaminated fluorides to be added; they do not require it. Thus, any community, anywhere, could halt the program any time, with the consent of its citizens, who surely would consent if given the facts.

Lead-tainted fluorides are waste products mainly of the aluminum and phosphate fertilizer industries, largely from US companies. But we’ve learned that in some communities sodium fluoride imported from Japan or sodium silicofluoride from Belgium are used. Neither of these nations fluoridates its own water supplies.

(24) (Don’t you get the feeling we’re in the same category as a Third World Country becoming a toxic waste dump for others?) In California recently the Attorney General and two environmental groups have sued the makers of brass pumps containing lead which could contaminate water from wells.

(25) But who is suing companies who sell lead-tainted products to cities for their fluoridation purposes? Who is suing the EPA for allowing it? Where are the lawsuits against the US Public Health Service and the Centers for Disease Control for adamantly promoting it?

In conclusion, there’s still the matter of lead being leached from old pipes. Anyone who argues that fluoridation had nothing to do with it will have to explain those well-preserved lead pipes from more than 2000 years ago in unfluoridated Roman water. 

REFERENCES:

(1) Book of Popular Science, Grolier, Inc., 1974, Vol.7, 63.
(2) Ibid.
(3) Book of Popular Science, Vol. 3, 167-169.
(4) Book of Popular Science, Vol. 7, 62.
(5) Encyclopedia Brittanica, 1957, Vol.21, 545.
(6) Ibid., 545.
(7) Ibid., 546.
(8) Ibid., 545A
(9) Book of Popular Science, Vol. 7, 63-64.
(10) Encyclopedia Americana, 1945, Vol. 1, 456.
(11) Encyclopedia Brittanica, 1957, Vol.1, 715.
(12) Book of Popular Science, Vol. 3, 39.
(13) Textbook of Pediatrics, Nelson WS, MD, WB Saunders Co., Philadelphia,London, 1964, 1557.
(14) Newsweek, “Lead and Your Kids,” July 15, 1991.
(15) Ibid.
(16) Ibid.
(17) Federal Register, Bol. 56, No. 110, June 7, 1991, 264.
(18) Ibid., 265-70.
(19) Book of Popular Science, Vol. 3, 74.
(20) Letter from the Tacoma Public Utilities, Dec. 2, 1992.
(21) Fluoride Report, newsletter, April, 1994, 5.
(22) Ibid.
(23) Book of Popular Science, Vol. 3,74.
(24) Letter from Tacoma Public Utilities, May 22, 1992.
(25) Kansas City STAR, April 19, 1994

Pb-divider-ss-300x14

macquarie-uni-logo

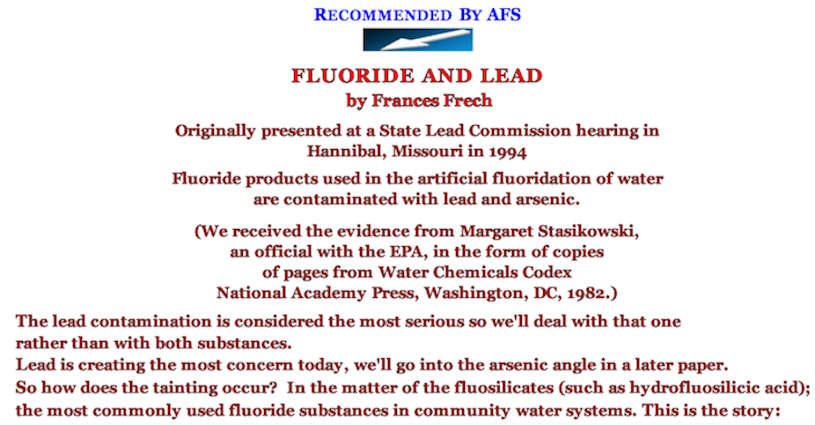
Lead in Plumbing Products and Materials 

 by – MP Taylor, PJ Harvey and AL Morrison

Pb-divider-ss-300x14

Lead-in-Roman-water-n

Pb-divider-ss-300x14

See also 

FLUORIDE LEAD AND PIPES

One of the most important lines of evidence
 that has been ignored is that which connects
silicofluorides with increased lead in water.

Pb-divider-ss-300x14

Plumb-solvency Exacerbated by Fluoridation-Dr. Geoff Pain

Global Decline in Tooth Decay
correlates with reduced Airborne Lead
(Pb) but water Fluoridation prevents further progress.

Pb-divider-ss-300x14

Lead Poisoning At Mount Isa And Fluoridation

Pb-divider-ss-300x14

Chloramine + Lead Pipes + Fluoride = Contaminated Tap Water +

Pb-divider-ss-300x14

Afican-Americans-f

Water Fluoridation Targets Black Americans

Pb-divider-ss-300x14

MORE INFO ON FLUORIDES AND LEAD ON OUR POST  

Water Treatment With Silicofluorides And Lead Toxicity

 Council LEAD Project NSW

 — THE DISAPPEARING  SPARROW—

Pb-divider-ss-300x14

There is a custom of using pipes for electrical grounding.

This accelerates lead corrosion and  also increases lead in drinking water.

Pb-divider-ss-300x14

MORE INFORMATION ON LEAD & FLUORIDATION – by John MacArthur 

Pb-divider-ss-300x14

BBC-NEWS-Mag.-m

The fatal attraction of lead

For millennia lead has held a deep attraction for painters, builders, chemists and winemakers – but it’s done untold harm, especially to children. And while it’s no longer found in petrol, you’ve still got several kilograms of it in your car. (It is still used in some aviation petrol.)

Element number 82 is one of a handful that mankind has known for millennia. The oldest pure lead, found in Turkey, was made by early smelters more than 8,000 years ago.

That’s because lead is very simple to produce. It often comes mixed up with other more coveted minerals, notably silver. And once the ore is out of the ground, thanks to its low melting point, the lead can easily be separated out in an open fire.

One place lead has long been mined is the Derbyshire Dales, at the southern end of the UK’s Peak District National Park.

Lead mine DerbyshireDisused lead mine in Derbyshire UK

As well as its tourist-friendly natural beauty, the area’s volcanic and limestone geology also provided the perfect conditions for mineralising the lead sulphide ore called galena.

For 100 million years the lead just sat there harmlessly, locked up in the rock. Then, 3,000 years ago, people began to dig it up. And then the Romans arrived. And soon enough boatloads of Derbyshire ingots were being shipped back to the Continent.

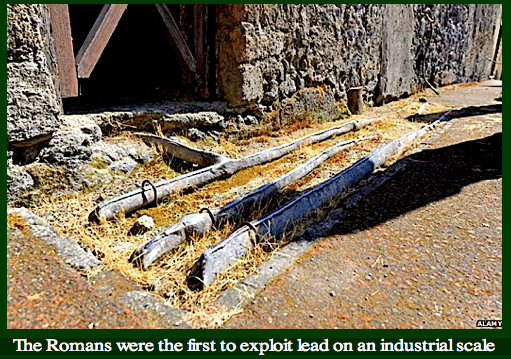
The Romans were the first to exploit lead on an industrial scale. Ice cores in Greenland contain traces of lead dust from 2,000 years ago, carried on the wind from giant Roman smelters. One of the largest, located in Spain, was operated by tens of thousands of slaves.

Lead found dozens of uses throughout the Empire. Being apparently insoluble, it was used to line aqueducts and make water pipes – the word “plumber” derives from the Latin for lead, plumbum.

Roman lead pipes

The Romans excelled at plumbing, unfortunately they used lead pipes.

“I think of it as the plastic of the past,” explains Derbyshire lead mining historian Lynn Willis. “It’s flexible, you can cast it into thin sheets, solder it into pipes.”

The metal was malleable and seemingly impervious to corrosion, and so – just like modern plastics – it became ubiquitous. And not just in Roman times.

“In a large house in the 17th Century you might find the table covered with [lead tableware], the cisterns holding the water, the drains, the pipes.”

Lead has a long association with the building trade, providing a waterproof material for roofing, window frames, and for sealing stone walls. And a heavy lump of lead on a string formed the plumb-line builders used to ensure those walls were vertical.

Peeling Lead Paint ff

The metal was found to have other magical properties. Lead carbonate, for example, has provided a cheap, durable paint since ancient times. Known today as “flake white”, it was prized by Old Masters such as Rembrandt because of the steadfastness of its colour and the beautiful contrasts it would bring to their oil portraits.

Meanwhile, glassmakers learned that adding in some lead oxide would yield glassware such as wine decanters that would glisten, because the lead refracted the light across a wider arc.

Unfortunately, a leaded crystal wine decanter turns out to be a singularly bad idea, according to Andrea Sella, chemistry professor at University College London, especially if the wine (or sherry, port or brandy) is held in it for a long time.

“The lead slowly dissolves out into the wine itself. The intriguing thing is that you get a compound that used to be known as ‘the sugar of lead’.”

This compound, lead acetate, not only looks like sugar, it also has an intensely sweet flavour, Prof Sella explains.

“One of the curious things is that the drink that you would put into your decanter would over time gradually become sweeter.”

But lead, of course, is also toxic. Once inside the body, it interferes with the propagation of signals through the central nervous system, and it inveigles its way into enzymes, disrupting their role in processing the nutritious elements zinc, iron and calcium.

And so history is littered with examples of people, often unwittingly, enhancing the flavour of their beverages with lead, with horrendous consequences for the health of the end-consumers.

The citizens of Ulm in Germany were plagued by agonising stomach cramps in the 1690s. But it was soon noted at a local monastery that some of the monks, who happened to abstain from drinking the popular local wine, were being spared by God.

The source was eventually identified as a lead oxide sweetener added to the wine – and then eliminated via what was possibly the world’s first formal ban on the use of lead.

In England, these same stomach cramps became known as “Devon colic” after a similar 17th Century outbreak, this time caused by the lead used in local cider presses.

Gout could also be brought on by lead poisoning, and became a hallmark of the English nobility in the 18th Century. The apparent cause this time was the 1703 Methuen Treaty between England and Portugal, better known as the “Port Wine Treaty”.

It cemented military friendship and favourable trade terms between the two nations, stimulating a booming trade in port. Guess what the wine came laced with? Lead acetate.

Lead-induced gout was all too familiar to the Romans too. They associated it with the morose god Saturn, who ate his own children.

The link was apt. Chronic lead exposure causes depression, headaches, aggression and memory loss. It can also cause sterility, and some suggest this explains the common failure of Roman aristocrats, such as Caesar Augustus, to produce a natural heir.

How were the Romans poisoned? Tiny amounts of lead in water pipes dissolve into soft water (the lime-scale from hard water stops this process). The Romans also handled lead in the form of coins, pots and dishes. And they used it in paints and cosmetics.

However, the biggest probable source was once again wine, specifically a sweetener-cum-preservative the Romans called sapa or defrutum.

Roman wall image ff

The Romans boiled concentrated grape juice down in lead pots into a syrup that helped extend the life of wines. Why lead pots? According to the winemaker Columella, “brass vessels give off copper rust, which has an unpleasant flavour.”

The outcome is clear from bones in ancient Roman cemeteries, which contain lead levels more than three times the modern safe limit recommended by the World Health Organization.

~  SOME KEY FACTS ON LEAD ~

lead image ff

  • The Babylonians used the metal for plates on which to record inscriptions

  • Malleable, ductile, and dense, it is a poor conductor of electricity

  • Symptoms of lead poisoning include abdominal pain and diarrhoea followed by constipation, nausea, vomiting, dizziness, headache, and general weakness

  • Resistant to corrosion

Whether this contributed to the apparent madness of emperors such as Caligula and Nero, and the eventual collapse of the Empire remains a contentious question among classical scholars.

But it’s clear that the Industrial Revolution unleashed a new wave of lead poisoning far greater than anything in ancient times, and this time it was the working classes rather than aristocrats who bore the brunt.

Derbyshire lead miners for example were often marked by a black line across their gums – brought on apparently by the chemical reaction between lead in the miners’ blood and sulphur released by bacteria in the mouth, after they had eaten certain kinds of food, including eggs.

The worst affected were those employed in smelting or in the manufacture of lead-based paints, who found themselves surrounded daily by lead fumes.

Person suffering from lead poisoningA black line on the gums is one sign of lead poisoning

Take the Sheffield paintworks, for example. After three months at the works, employees typically developed a skull-like complexion of pallid skin and dark recessed eyes, Willis says. Melancholy, pain, infertility and death followed.

“In the 1870s, the doctor reported that six people out of 70-80 had died the previous year,” says Willis. But he also noted that in his father’s time in the 1830s they had died “like sheep”.

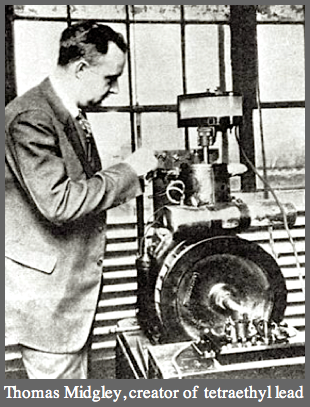
Given that lead poisoning had been around so long, the actions of the chemist Thomas Midgley Jr appear to have been reckless in the extreme. He is the man who put lead in petrol.

In 1921 as a brilliant young chemist at General Motors he discovered that adding the compound tetra-ethyl lead made engines run more efficiently, eliminating the uncontrolled knocking of early motorcars.

The product was marketed as the benign-sounding “ethyl”. When challenged about the dangers of the lead content, Midgley called a press conference at which he poured the chemical over his hands and breathed in its vapour for a full minute, claiming he could do so every day without ill effect.

In reality, both before and after this incident Midgley spent months plagued by the effects of lead poisoning. GM’s ethyl plant in New Jersey, meanwhile, was forced to close after several workers went mad and some died. The press renamed ethyl “looney gas”.   Midgley was a tragic individual.

Thomas Midgley f

Later in life he contracted polio and became bed-ridden, so he designed a system of pulleys to raise himself up – only one day he became entangled in them and died of asphyxiation.

However, the greatest tragedy was his legacy. IT WAS MIDGLEY WHO INVENTED CHLOROFLUOROCARBONS – CFCs the refrigerant gases later found to be responsible for opening up the hole in the ozone layer and increasing the incidence of skin cancer. And cars – far more of them than Midgley could have conceived of in the 1920s – would continue to belch out lead bromide fumes for decades.

Although this was a far more dilute source of poisoning than Roman sapa or the fug of a Victorian paintworks, it was incomparably more far-reaching, affecting every city on the planet. And this time the victims were children.

It was another American, the paediatric psychiatrist Herbert Needleman, who was responsible for finally getting the lead taken out of petrol. – [However not in all aviation fuels.]

In the 1970s and 1980s he discovered that even very low levels of lead exposure did irreversible damage to infants, including unborn babies. As they grew up, their IQs were lower, they had trouble concentrating, and often dropped out of school.

As young adults, data suggested, they were more likely to become bullies, delinquents, criminals, teenage parents, drug addicts, unemployed, and so on. Needleman concluded that the lead had permanently weakened their ability to resist dangerous impulses.

mapped closely to when their respective crime statistics peaked two decades later.

Thanks in large part to Needleman’s work, the US began phasing out tetraethyl lead in 1975, and most of the planet followed suit. Yet it is only now that the possible scale of the harm done by lead poisoning is becoming apparent.

That’s because many academics now believe leaded petrol was responsible for a global crime wave that peaked in the 1990s.

One such is economist Jessica Wolpaw Reyes of Amherst College in the US. “When we had leaded generations in the 1960s and 1970s, they would have been far more likely to commit crimes, especially violent crimes, in the 80s and 90s,” she says.

She found that the timing of when petroleum companies phased out leaded petrol in individual US states between 1975 and 1996.

lead-exposure-crime


Other studies looking at the difference between countries worldwide found similar results. However, the link between lead and crime is still disputed, witplenty of other explanations forwarded for the global drop in crime rates.

FIND OUT MORE:

In Elementary Business, BBC World Service’s Business Daily goes back to basics and examines key chemical elements – and asks what they mean for businesses and the global economy.
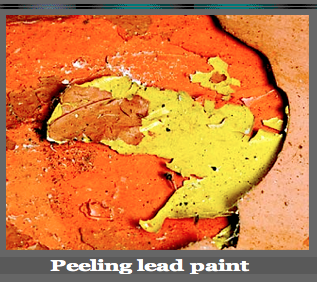
All paints, even durable lead-based ones, are prone to crumble eventually. But being a chemical element, the lead never breaks down or disappears. Instead, the dust can be inhaled, or the sweet-tasting flakes can be consumed by a curious toddler.

In the UK the ban has extended beyond bulk household paints to include artists’ suppliers, such as the 150-year-old L Cornelissen in London’s Bloomsbury.

“It is a traditional paint and has passed the test of many, many centuries,” says the shop’s owner, Nicholas Walt, ruefully. “Petrol’s pretty dangerous too, but we’ve learned how to handle it, and it’s a shame that we can’t do the same with flake white.”

Lead can still be found as a radiation shield at your doctor’s surgery, or as a roof lining material in northern Europe. It’s also being used to waterproof and immobilise subsea electric cables for offshore windfarms.

But the biggest use by far is, ironically enough, still in your car. Almost 90% of lead is used to make batteries. Some of them sit in hospitals or mobile phone beacons to provide back-up power in case the grid goes down. But most of them are used to start people’s cars every morning.

Lead is not the most obvious metal for a car battery. Coming from the bottom of the periodic table, it is exceptionally dense, and a great weight to carry around – about as far from a lithium battery as you can get.

However, unlike other batteries, it will provide the initial surge of energy needed to get your engine moving, again and again for years, without breaking. Even hybrid and fully electric cars typically contain a lead acid battery to complement their main lithium or metal-hydride one.

And now for the good news: Unlike a can of leaded petrol, a lead-acid battery is a sealed unit. The lead never escapes. And that remains true even at the end of the battery’s life.

“Lead has the highest recycling rate of any metal,” says Dr Andy Bush, head of the International Lead Association.
“The recycling rate in Europe and North America [for batteries] is 99%.”

He says this isn’t just because of environmental regulations. Lead is a very easy metal to recycle.

Batteries for recycling
Recycled batteries

That much is clear from a visit to the HJ Enthoven recycling plant at Darley Dale – a last vestige of the Derbyshire lead mining industry.

They take lead batteries, then smash them to pieces in a contained unit. That makes extracting the metallic lead a simple task as it just sinks to the bottom. Lead is also recovered from the sulphurous electrolyte fluid.

All that molten lead is then poured into ingots that can be sent straight back to a battery manufacturer. Even the recovered plastic gets turned back into battery casings.

“It’s a completely closed loop,” says the plant’s manager, Peter Allbutt. “This is a material that is recyclable again and again and again.”

All the same, you may still be surrounded by lead that doesn’t form part of this loop. It remains in some old pipes and in older layers of household paint.

Amazingly, a handful of countries – Iraq, Yemen, Burma, North Korea – continue to use leaded petrol. And there are many more countries in the world, including India and China, which are still getting to grips with the pollution from their lead smelting industries.

And in some places it’s found its way into the earth.

In the Derbyshire Dales, the average lead content in the region’s soil, at 0.05%, is 10 times the UK national average. In some hotspots – downwind from old smelters, or where miners dumped their spoils – it can be as high as 3%.

And it will just continue to sit there, until someone cleans it up.

Pb-divider-ss-300x14

Faraday observed in the 1830s that lead fluoride when

heated to red hot conducts electricity similar to platinum.

Pb-divider-ss-300x14

THE SECRET HISTORY OF LEAD

Well put together recommended reading by us.

Full text  → HERE

EXTRACT: … Lead was outlawed as an automotive gasoline additive in this country in 1986–more than sixty years after its introduction–to enable the use of emissions-reducing catalytic converters in cars (which are contaminated and rendered useless by lead) and to address the myriad health and safety concerns that have shadowed the toxic additive from its first, tentative appearance on US roads in the twenties, through a period of international ubiquity only recently ending. Since the virtual disappearance of leaded gas in the United States (it’s still sold for use in propeller airplanes), the mean blood-lead level of the American population has declined more than 75 percent. A 1985 EPA study estimated that as many as 5,000 Americans died annually from lead-related heart disease prior to the country’s lead phaseout…

Pb-divider-ss-300x14

More Dangers of Lead – Children

Lead poisoning is a national problem. In children under the age of 6, the threshold for elevated blood lead levels is just 5 micrograms per liter. Because there is no safe level of exposure, even this seemingly small amount is enough to be damaging, especially to children.

Lead was once commonly used in fuel, household paint and plumbing materials, and is still often found in older buildings. Lead is a known neurotoxin, and children are especially susceptible to its effects. It can cause irreparable damage to almost all organ systems in the human body, but is most known for its ability to disrupt cognitive development and cause learning disabilities.
The neurological effects of lead are generally the most immediate, but this does not mean that other ill effects cannot occur, even later in life. According to the Agency for Toxic Substances and Disease, childhood lead poisoning can contribute to other health issues later in life such as kidney issues, hypertension, reproductive difficulties and it can also affect the health of future offspring. So not only can lead poisoning harm children, it can set the stage for your children’s children to have health issues.

Pb-divider-ss-300x14

See also our six postings below  ↓ ↓ ↓

Lead Poisoning At Mount Isa And Fluoridation

Pb-divider-ss-300x14

http://www.abc.net.au/news/2015-10-06/efforts-to-manage-mount-isa-lead-exposure-questioned/6830098   

Pb-divider-ss-300x14

http://www.abc.net.au/news/2015-10-06/mining-town-students-perform-poorly-due-to-contamination/6829792  

Pb-divider-ss-300x14

http://www.ibtimes.com.au/pregnant-womens-exposure-lead-may-have-lasting-effects-can-be-passed-grandkids-1471841  

Pb-divider-ss-300x14

 Water Treatment With Silicofluorides And Lead Toxicity

Pb-divider-ss-300x14

LEAD IN AVIATION FUEL – Fluoridation Queensland

Pb-divider-ss-300x14

snail-we-all-need-clean-water


fluoridation-queensland-logo


new-devider-fq


On the same topic:

THE PINEAL GLAND

A Short Selection Of Comments

From Famous Researchers

blue line

rodger-d-master-f

With special thanks to Rodger D. Masters.

THE SOCIAL IMPLICATIONS OF NEUROSCIENCE:

LINKING BRAIN BIOCHEMISTRY AND VIOLENT CRIME

Roger D. Masters (Dartmouth College)·

THIS FILE IS A DRAFT OF THE CHAPTER WITH THIS TITLE IN:

Richard W. Bloom and Nancy Dess, eds.,

Evolutionary Psychology and Violence:

A Primer for Policymakers and Public Policy Advocates

(Westport: Praeger, 2003), pp. 23-56.

ABSTRACT

It is impossible to deny that a revolution in neuroscience and other areas of biology has taken place over the last half-century.  The  estimates of 83 million Americans taking drugs like Prozac for depression and 11 million children on Ritalin for hyperactivity indicate it is time to reconsider the role of brain chemistry in social behavior and violent behavior.  Since it is obvious that loss of impulse control can contribute to violent outbursts – and evidence shows that some toxic chemicals (such as lead) can have this effect, it is time to consider neuroscientific evidence linking environmental toxins and rates of violent behavior.  To illustrate the implications of the new issues involved, I focus on a hitherto unexplored example.  Two chemicals (H2SiF6 and Na2SiF6, jointly called “silicofluorides” or SiFs) are used to treat public water supplies of 140 million Americans even though, as the EPA has admitted, they never been tested for safety.  To illustrate the interdisciplinary complexities entailed when linking brain chemistry to policy decisions concerning violent crime, our argument has four main stages: first, why might SiFs be dangerous? Second, what biochemical effects of SiF could have toxic consequences for humans?  Third, on this basis a research hypothesis is formulated to measure the types of harm.  In this case, we predict children in communities using SiF should have increased uptake of lead from environmental sources and higher rates of behavioral dysfunctions such as hyperactivity (ADHD) known to be caused by lead neurotoxicity.  Finally, the hypothesis is tested using multiple sources of data including rates of violent crime studied using a variety of multivariate statistical techniques (including analysis of variance, multiple regression, and stepwise regression).  As this outline should make clear, a combination of interdisciplinary perspectives and great prudence is needed to link research in neuroscience to policies concerning violent crime,  If confirmed, however, the potential benefits of hypotheses like the one tested below may be great, revealing the generally unsuspected value of including neuroscientific research in the analysis of human social behavior.

Requests for reprints and correspondence should be directed to: Prof. Roger D. Masters, Department of Government, HB 6222, Dartmouth College, Hanover, NH 03755. Email:  Roger.D.Masters@Dartmouth.edu

The full version of the above is on the net,

and as the above suggests adding silicofluorides

to drinking water amounts to domestic terrorism.

 Editor’s note:

Zinc deficiency can account for bad behaviour – F. is an antagonist of zinc.

blue line

Fluoride and Crime in the USA

Original  →  HERE

SUMMARY:

A four-part study explores possible connections between 

water fluoridation and crime in America.

Part A, Media-reported crime database and fluoridation, presents an observational database of violent crimes, mostly multiple shootings, and finds an unusually high percentage of them associated with water fluoridation, suggesting the existence of a “fluoride-related” category of crime. A low-end threshold for the toxic effects of fluoridation of 0.3 ppm is identified, and the term “fluoridated” is defined here as having a fluoride level of 0.3 ppm or higher. In Part B, Online crime database and fluoridation, a published database of year 2000 crime data for 327 US cities over 75,000 population, representing 80 million Americans, was expanded to include fluoridation data for these cities. Water fluoridation was consistently associated with high crime rates at all population levels. Part C, Book crime database and fluoridation, examines year 2000 crime statistics for six major crimes in the same 327 cities according to their fluoridation status. Cities having natural fluoridation, or which use silicofluorides or sodium fluoride, are shown to have substantially higher crime levels than nonfluoridated cities. Part D, Lead related crime, quantifies the amount of crime historically associated with lead intoxication, thus identifying a remainder which may be associated with fluorides. This study presents a data-backed hypothesis about one possible cause of crime; it is not a definitive statement about crime causality.

Keywords: Crime; Fluoridation; Fluoride toxicity; Lead toxicity; School shootings; USA.

INTRODUCTION

In 1999 I observed that nine of ten randomly-selected school shootings in America had occurred in fluoridated communities, and that the shooter in the tenth had used Prozac, a fluorinated pharmaceutical.b With less than 60% of the U.S. population fluoridated, a non-random correlation between fluoride and violence was suspected.

Others have connected fluorides with violence. Grandjean et al identified significantly elevated mortality due to violence and suicide among Danish cryolite workers.1 Several studies have examined effects of fluoride on mental development, brain function, and behavior. Li et al, Zhao et al, and Xiang et al showed that high fluoride exposure reduces intelligence in children.2-4 Varner et al documented the effects of aluminum fluoride and sodium fluoride with neuronal damage, dementia, and mortality in rats.5,6 Mullenix et al documented detrimental CNS effects of sodium fluoride in rats, showed that timing of fluoride (a).

Correspondence: Jay Seavey, AIA emeritus, P.O. Box 5234, Manchester, NH, USA 03108-5234. E-mail: jayseavey1618@earthlink.net bKip Kinkle murdered his parents, then killed 2 and wounded 22 in a school shooting on 5/21/98 in unfluoridated Springfield, OR. The police report indicated that he had previously been treated with Prozac [fluoxetine hydrochloride]. A structural formula for Prozac appears in Physicians’ Desk Reference, 53rd ed., Montvale NJ: Medical Economics; 1999. p. 924. The other nine fluoridated locations noted at the time were: Moses Lake, WA; Bethel, AK; Pearl, MS; West Paducah, KY; Jonesboro, AR; Edinboro, PA; Fayetteville, TN; Littleton, CO; and Taber, Alberta, Canada. My observations were made at a public hearing on fluoridation held in Manchester, NH, and reported in The Union Leader (Manchester, NH)1999 Sept 23, Sect. A:1,20.

 Fluoride 2005;38(1)

12 Suavely [?] exposure can be developmentally critical, identified sex-linked differences in some of these effects, and demonstrated fluoride accumulation in the brain.7 Others have explored heavy metal intoxication with and without fluorides, and their mental and behavioral effects. Needleman et al showed psychological impairment and behavioral deficits in children from lead exposure.8 Masters and Coplan focused attention on elevated blood lead levels when silicofluorides are used for water fluoridation.9 Other work by Masters et al addressed manganese and lead toxicity, and silicofluoride use, relative to crime, alcoholism, and cocaine/crack abuse; and identified a time lag between the removal of lead from gasoline, and a later decline in crime rates.10 Fluoride, by itself and in conjunction with heavy metals, appears to alter brain function and to predispose some humans to violence. It seemed timely to study more directly the relationship between fluoridation and crime: cumulatively, these earlier studies led to an expectation that such a relationship could be demonstrated.

The work reported here is divided into four parts, A, B, C and D. They evolved sequentially over about four years, and do not reflect a methodology adopted from the outset.

MATERIALS AND METHODS

Part A: Media-reported crime database and fluoridation

Stories were accumulated from news mediaa over a period of approximately two years and assembled into a database (“A”) of 152 events, most of which occurred between 1993 and 2001 (media stories sometimes reported sequelae, such as court proceedings). The stories were primarily of multiple shootings, but also included unexecuted events involving weapons and similar ideation. The database also included some stabbings, drownings, arsons, and bombings, the

A The collecting of news stories utilized The Union Leader (Manchester, NH), and America Online; many of the stories from these sources originated from The Associated Press or from Reuters. The stories were selected, based on their content and on my intuition, from my routine daily reading, rather than from a methodical or exhaustive search using, for example, keywords or search engines. Events were typically multiple murders, usually with firearms, having an apparent “senseless” character to them. Events with known motives (except crimes grossly disproportionate to their motives), or which were known to be gang-or drug-related, were excluded. Domestic violence was excluded unless the victims included children. Stories were typically clipped, or were downloaded and printed, and placed in a file; periodically, the file would be reviewed, and the fluoridation status of the locations and of the perpetrators would be determined using the Fluoridation Census 1992. American Automobile Association roadmaps for the entire United States were regularly consulted to gain information about locations mentioned in news stories. In many cases telephone calls were made to get detailed information about local water systems. Calls were also made, with far less success, to get information about perpetrators and their life histories. Law enforcement personnel were generally reluctant to divulge much in the aftermath of an event, while it was still being investigated. Efforts to gain information from news writers were equally fruitless. In many instances, a succession of news stories over a period of time was needed to extract basic information about an event, as the initial reporting about a multiple shooting might be sketchy. On several occasions, after a major event, the news sources carried a list of 10 or 15 similar events—school shootings, workplace shootings, etc. These event lists, if they included events I had not already listed, were typically searched out using the Internet. This, along with current reporting of event sequelae [squealed], such as court proceedings, provided an avenue for including events going back several years. These lists also provided a basis for comparison: by the time I had accumulated 152 events, the database was more inclusive, by a factor of ten, than the longest of these lists which the media had presented; yet it is by no means deemed to be exhaustive.

Fluoride 2005;38 (1)

Water fluoridation and crime in America 13 common denominator being the heinous and senseless character of the crimes, and an absence of apparent motive. In each case, after an event was identified for inclusion in the database, a search was later made to determine the fluoridation status either of the place where the event occurred, or of the place where the perpetrator lived. A fluoridated community is defined for this study as one having a fluoride level of 0.3 ppm or more in the public water supply.a A statistical analysis was then performed, comparing the “fluoridation-connection” of the collected events with the nationwide fluoridation level. As a control, database “B” was developed, utilizing 164 randomly selected stories published between 1993-2001 in “The Armed Citizen”, a regular column in American Rifleman, a monthly magazine published by the National Rifle Association. These stories reported incidents in which firearms were used by citizens for self-defense.

Part B: Online crime database and fluoridation

Noting that Part A was somewhat limited by the particular type of crime it focused on, I broadened the search to include publicly-available data on a wider category of crimes. A database by Morgan Quitno Press (MQP), Lawrence, Kansas, published in book form and posted online, listed crime data for the year 2000 for 327 American cities having populations over 75,000, and rated their comparative safety according to a score or index which represented their aggregate incidence, based on FBI crime statistics, for six major crimes: murder, rape, robbery, aggravated assault, burglary, and motor vehicle theft.11,12 The score for each of the 327 cities was referenced to a national average of 0.00, and

aThe U.S. Public Health Service has generally defined “fluoridated” water as having a fluoride level at or above 0.6-0.7 ppm. The reason for selecting a lower level of 0.3 ppm to define “fluoridated” for the purposes of this study is as follows: Human physiology has some capacity for detoxifying and eliminating fluorides. Dental fluorosis offers the most readily-available and visible indicator for fluoride intoxication. Therefore, if we can establish a level below which this toxicity is not evident, it provides at least a speculative basis for considering that other toxic effects we are hypothesizing about may also not manifest themselves below this level. In other words, we are not interested in a level above which some hypothetical dental benefit allegedly occurs; we are concerned, rather, with the level below which toxic effects are not in evidence. H. Trendley Dean, DDS, in “Epidemiological studies in the United States” (In: FR Moulton, editor. Dental Caries and Fluorine. Washington, DC: American Association for the Advancement of Science, 1946. p. 5-31.) provides data from America necessary to make this determination. While Dean does not identify 0.3 ppm as a definitive cut-off level for the appearance of dental fluorosis, his tabulated data in Table XI, page 23, show that the prevalence of dental fluorosis begins to rise sharply above a fluoridation level of 0.3 ppm, and that the few observed cases occurring below this level are characterized as “very mild”. The appearance of dental fluorosis probably does not hinge solely on fluoride in drinking water; it probably reflects nutrition in general, and the mix of other minerals in the drinking water. Fluoride exposure relates partly to diet, being high, for example, in a diet high in seafood. The toxic manifestations of fluoride, it is believed, are also reduced by activities which remove fluoride from the system, such as hot-water bathing or sweat bathing. There is a discussion in Fluoridation: The Great Dilemma (Waldbott GL, Burgstahler AW, McKinney HL. Lawrence KS: Coronado Press, 1978. p. 180), of significant levels of dental fluorosis on the South Atlantic island of Tristan da Cunha, where the fluoride level is 0.2 ppm. This, however, seems to be the extreme end of the spectrum, and it may reflect a diet high in fish, but possibly relatively deficient in Vitamin C, calcium, and/or magnesium. For all of these reasons, but particularly on the basis of Dean’s American data, 0.3 ppm and above was chosen to define the term “fluoridated”. It is not suggested that fluoridation levels below 0.3 ppm have no toxicity, or that this represents a “safe” level of fluoride in water.

Fluoride 2005;38(1)

14 Seavey

scores ranged from –84.94 (safest) to 373.28 (most dangerous). The MQP database for its “Safest Cities Award” includes nearly 80 million Americans—about 28.5% of the U.S. population. a I modified this database by adding fluoridation data for each of the 327 cities, and then sorted the list into six groups by population size. Within each group, cities were listed according to increasing “score” or “crime index”. Each of the six groups was then bifurcated, to identify a Low Crime subgroup and a High Crime subgroup within each population group. Total fluoridation incidence for each of the six population groups was determined, and its percentage was calculated. These percentages determined the expected fluoridation incidences for the Low Crime and High Crime subgroups within each population group. Expected incidences were then compared with observed incidences for each of the 12 subgroups, and the differences were noted. (See Table 1.) A two-way table of the differences was developed, and the chi-squared statistic was calculated. (See Table 2.)

Part C: Book crime database and fluoridation

MQP does not tell us in City Crime Rankings, 8th edition, what formula was used to generate scores for its “Safest City Award.” While these scores are said to allow a direct comparison of cities on the basis of their crime rates, we are not told how these scores or crime index figures can be translated into actual crime rates, and thence, using population data, into actual numbers of crimes. For this reason, I have used MQP’s more detailed published crime rate data, to develop this information.13 For each of the 327 cities, actual year 2000 rates for each of the six major crimes were entered and then totaled into an aggregate crime rate for each city. Fluoridation data were then entered for each city. The 327 cities were then sorted in database “327” according to their fluoridation status. Within each of the fluoridation categories, the cities were sorted by ascending aggregate crime rate.

Part D: Lead related crime

The connection between lead intoxication and criminal behavior appears to be well established.9 The phase-out of leaded gasoline began in the U.S. in 1976;14 airborne pollution from this source was the primary cause of lead intoxication, with lead from paints and from solder in food cans generating further exposures.

As documented by the National Health and Nutrition Examination Surveys (NHANES) blood lead levels in Americans aged 1–74 declined by 78% between 1978 and 1991, and by 76% in ages 1–5. 15 Subsequent research shows the aIt is stated on p.1 of City Crime Rankings11 under the heading “Methodology”: “First, city and metro crime rates for six basic crime categories—murder, rape, robbery, aggravated assault, burglary and motor vehicle theft—were plugged into a formula that measured how a particular city or metro area compared to the national average for a given crime category. The outcome of this equation was then multiplied by a weight assigned to each of the six crime categories. For this year’s award (2000), each of the six crimes was given equal weight. By weighting each crime equally, cities are compared based purely on their crime rates and how they stack up to the national average for a particular crime category. These weighted numbers then were added together for a city or metro area’s final score.”

Fluoride 2005;38(1)

Table 1. 327 Cities grouped by population, with groups bifurcated into high and low crime sub-groups

Population Group Size

Crime level subgroup

[N/2 or (N-1)/2]

High [24]

Low [24]

High [18]

Low [18]

High [22]

Low [22]

High [15]

Low [15]

High [31]

Low [31]

Average crime index

[Difference between the high & low subgroups]

183.51

42.93 [140.58] [10.26%]

120.81 268,888

-0.57 252,535 [121.38] [6.48%]

120.73 176,726

7.09 178,424 [113.64] [0.96%]

92.29 134,370

-34.56 134,213 [126.85] [0.12%]

61.35 110,713

-42.89 110,342 [104.24] [0.34%]

Fraction of population group fluoridated

[%]

41/48 [85.417]

26/37 [70.270]

25/44 [56.818]

16/30 [53.333]

34/63 [53.968]

63/105 [60.000]

Fluoridation status of population subgroups based on the fraction of the population group fluoridated

>350,000 (C) [48]

200,000– 350,000

(D) [37]

150,000– 200,000

(E) [44]

125,000– 150,000

(F) [30]

100,000– 125,000

(G) [63]

75,000– 100,000

917,401

High 63.46 85,667 [52]

(H) [105] Low -44.62 85,453

[52]

[108.08] [0.25%]

Water fluoridation and crime in America 15

 (Data- base)

[N]

Average population size

[% difference in population

size]a

832,072

Number expected to be fluoridated

20.50 20.50

12.65 12.65

12.50 12.50

8.00 8.00

16.73 16.73

31.20 31.20

Number observed to be fluoridated

23.00 18.00

15.00 10.00

16.00 9.00

12.00 4.00

18.00 16.00

34.00 29.00

Difference between observed & expected

+2.50 -2.50

+2.35 -2.65

+3.50 -3.50

+4.00 -4.00

+1.27 -0.73

+2.80 -2.20

a The % difference in population size was calculated by taking the difference in the average population between the two subgroups, dividing by the size of the smallest group, and multiplying by 100.

Fluoride 2005;38(1)

16 Seavey

Table 2. Chi-squared statistics for 327 cities grouped by population, with groups bifurcated into sub-groups by crime level and fluoridation status

Population Group Size

Expected (based on the fraction of the population group non-fluoridated) and observed numbers of non-fluoridated population subgroups

Crime level subgroup

[N/2 or (N-1)/2]

High [24]

Low [24]

High [18]

Low [18]

High [22]

Low [22]

High [15]

Low [15]

High [31]

Low [31]

75,000– 100,000 [52]

(H) [105] Low [52]

Expected (based on the fraction of the population group fluoridated) and observed numbers of fluoridated population sub- groups

(Database)

[N]

Number expected to be

fluoridated

20.50 20.50

12.65 12.65

12.50 12.50

8.00 8.00

16.73 16.73

31.20 31.20

Number observed to be fluoridated

23.00 18.00

15.00 10.00

16.00 9.00

12.00 4.00

18.00 16.00

34.00 29.00

Difference between observed & expected

+2.50† [0.3049]*

-2.50† [0.3049]*

+2.35† [0.4366]*

-2.65† [0.5551]*

+3.50† [0.9800]*

-3.50† [0.9800]*

+4.00† [2.0000]*

-4.00† [2.0000]*

+1.27† [0.0964]*

-0.73† [0.0319]*

+2.80† [0.2513]*

-2.20† [0.1551]*

Number

expected to be non-fluoridated

3.50 3.50

5.35 5.35

9.50 9.50

7.00 7.00

14.27 14.27

20.80 20.80

Number observed to be non-fluoridated

1.00 6.00

3.00 8.00

6.00 13.00

3.00 11.00

13.00 15.00

18.00 23.00

Difference between observed & expected

-2.50† [1.7857]*

2.50† [1.7857]*

-2.35† [1.0322]*

2.65† [1.3126]*

-3.50† [1.2895]*

3.50† [1.2895]*

-4.00† [2.2857]*

4.00† [2.2857]*

-1.27† [0.1130]*

0.73† [0.0373]*

-2.80† [0.3769]*

2.20† [0.2327]*

>350,000 (C) [48]

200,000– 350,000

(D) [37]

150,000– 200,000

(E) [44]

125,000– 150,000

(F) [30]

100,000– 125,000

(G) [63]

High

*(Observed- Expected) 2/Expected. Total for high crime subgroup 10.9522, low crime subgroup 10.9705, both subgroups χ2 =21.9227

†Comparing the expected and observed numbers of subgroups that were fluoridated. p<0.05, χ2=21.9227, df=11.

Fluoride 2005;38(1)

Water fluoridation and crime in America 17 continuation of this decline at a reduced rate through 1994.16 (See Figure, which plots historical data with solid lines, projects these trends with dashed lines, and compares trends for lead and crime levels, starting with peak numbers for each representing 100% on the same scale.) Lagging the peak and decline of lead levels by about 13 years, violent crime peaked in 1991, and decreased about 30% by 2000.a,17

Blood lead μg/dL 109 4000

US average crime rate per 100,000 population in children aged 1–5 yrs

8 7 3000

15 14 13 12 11

6000 5000

6 5 2000 4 3 2 1 0

0 1976 1980 1984 1988 1992 1996 2000 2004 2008

NHANES NHANES NHANES II III–1 III–2

NHANES = The National Health and Nutrition Examination Surveys Figure. Declines of blood lead and crime

RESULTS

Part A: Media-reported crime database and fluoridation

The carnage for 134 executed events in database “A” includes 325 killed and 224 wounded—about 4.1 casualties per event. b At the midpoint of the period in which these events occurred—March 1997—an estimated 57.5% of the US population was fluoridated. c Of the total of 152 executed and ideational events listed in database “A”, 128 (84.21%) occurred in fluoridated communities or were committed by criminals from fluoridated communities. Of 128 locations

A City Crime Rankings17 shows that crime had hit a similar peak of 5,850 per 100,000 in 1981, dropped to 5038.4 for unclear reasons by 1984, and then increased for 7 years to its 1991 peak of 5,898.4. bThe 1995 bombing of the Federal Building in Oklahoma City is included in database “A”, but the casualties [168 killed, 853 wounded] are not included in this summary, as they would badly skew the portrayal of a typical event. Timothy McVeigh, the convicted bomber, grew up in the fluoridated town of Pendleton, New York, and was stationed at two fluoridated army bases, Fort Benning, GA, and Fort Riley, KS. McVeigh’s remorseless lack of empathy for his victims is believed to exemplify the mental condition of a fluoride-intoxicated killer.

C Data extrapolated/projected from chart and graph, p. xxii- xxiii of Fluoridation Census 1992. US Department of Health and Human Services, Public Health Service, Centers for Disease Control and Prevention, National Center for Prevention Services, Division of Oral Health, Atlanta Georgia 30333. September, 1993. An annual increase in the fluoridated population of 0.4%, from a 12/31/92 level of 55.8%, is projected.

1000

Fluoride 2005;38(1)

18 Seavey related to these events, 98 use silicofluorides, 17 use sodium fluoride, 12 have natural fluoridation, and one combines natural and artificial fluoridation. The average fluoridation level for these 128 communities is 0.983 ppm, and the range is from 0.3 ppm to 4.9 ppm.

Using a population mean of 0.575, a one-sample t test determined the probability of randomly selecting from a 152-count simple random sample (SRS) a sample mean of 0.8421. The null hypothesis, that water fluoridation and these violent crimes vary independently and are unrelated, is rejected (P<0.0005, t=9.001, df=151).18 For database “B”, it was expected that 57.3%, or 94 of the 164 locations identified would be fluoridated. The sample mean was 98 of 164, or 59.8% (one-sample-t-test: P>0.25, t=0.5883, df=163). The chance is thus better than 1 in 4 that the null hypothesis is true, i.e., that fluoridation and gun-based self-defense are randomly associated. So this is a useful control, allowing us to rule out fluoridation-related vagaries of crime reporting or of firearm distribution as a basis for the findings in database “A”. Nevertheless the only valid inference from database “A” concerns the extreme improbability of randomly observing 84.21% fluoridation-related events in a 152-count SRS when only 57.5% were expected.

Crime reporting in the media, and the statistical categorization of crime by the F.B.I., lack at this time a nuanced awareness for identifying “fluoride-related” crime. Whether database “A” demonstrates the objective existence of such a category, or whether it demonstrates that an observer can learn to identify such events from subtle cues found in news stories, it may be seen that both possibilities strongly suggest that such a category exists. The development of database “A” was in any case a necessary step for building a hypothesis of a connection between water fluoridation and crime.

Part B: Online crime database and fluoridation

The six population groupings eliminate city size as a confounding variable, and provide a spread for analyzing variance. Each of the six High Crime subgroups had an average “score” or “crime index” at least 100 points above its corresponding Low Crime subgroup. All six High Crime subgroups had more places fluoridated than expected; all six Low Crime groups had fewer places fluoridated than expected (P<0.05, χ2 = 21.9227 df =11).19 This validates the following preliminary inference: “In American cities having population over 75,000, high crime levels appear to be significantly correlated with water fluoridation.”

Part C: Book crime database and fluoridation

The results are summarized in Table 3. The fluoridation status “Combined”— which is a combination of natural and artificial fluoridation—is an anomaly in having a crime rate 2.9% lower than the non-fluoridated cities.

All of the other types of fluoridation are associated with elevated crime rates. Compared to the crime rate for non-fluoridated cities, natural fluoridation shows a 16.5% higher crime rate; sodium silicofluoride a 37.6% higher crime rate; hydrofluorosilicic acid a 46.8% higher crime rate; and sodium fluoride an 84.9%

Fluoride 2005;38(1)

Water fluoridation and crime in America 19 higher crime rate. Table 3 incorporates population data which are used to convert these elevated crime rates into a putative number of excess crimes associated with water fluoridation in these cities.

Fluoridation statusa

No 122 fluoridation

Combined (natural 12 & artificial)

Natural 18

Sodium silico- 56 fluoride (NaSiF6)

Hydrofluorosilicic 112 acid (H2SiF6)

Sodium fluoride 7 (NaF)

Totals 327 Averages –

Table 3. 327 cities grouped by fluoridation stat

Num- Average ber population

Total population b

Total for 6 major crimes for year 2000

Crime rate, for 6 major crimes, per 100 000 population

Crime rate compared to no fluoridation cities

of cities Excess crimes compared to no fluoridation

cities c

1,813.9 1,760.8 2,112.5 +298.6 +15,322

159,099

443,526

285,077

341,713

257,890

213,962

– 242,756†

19,410,033 352,077 5,322,307 93,715 5,131,391 108,401 19,135,905 477,747 28,883,706 769,289 1,497,736 50,245

79,381,078 1,851,474 – –

0.0 -53.1 -2,826

*The data are from database “327”. aFluoridation data are generally taken from Fluoridation Census 1992 [US Department of Health and Human Services, Public Health Service, Centers for Disease Control and Prevention, National Center for Prevention Services, Division of Oral Health, Atlanta, Georgia 30333, USA; September, 1993] with some corrected and updated information based on telephone inquiries. The category “Other” identified in the Fluoridation Census 1992 has been identified here as “Combined”. bPopulation and crime data are from Morgan KO, and Morgan S, editors, City Crime Rankings, 8th ed. Lawrence, KS: Morgan Quitno Press; 2001. c“Excess Crimes” are calculated by dividing the total population figure on a line by 100,000 and multiplying the result by the crime rate compared to no fluoridation cities on that line. These “excess crimes” are only those for the 327 cities over 75,000 population, totaling 28.5% of the US population. †The total population, 79,381,078, divided by 327, yields the average population per city, 242,755.5902, which is rounded to the nearest whole number. ‡First, the total population, 79,381,078, is divided by 100,000, yielding 793.81078. Second, the total number of crimes, 1,851,474, is divided by this 793.81078, yielding the quotient 2332.387071, which is rounded to two decimal places. This is the average crime rate per 100,000 population for all the 327 cities, including the 122 which are not fluoridated.

2,496.6

2,663.4

3,354.7

– 2,332.39‡

+682.7 +130,640

+849.5 +245,367 +1,540.8 +23,077

– +411,580 – –

0.0

Fluoride 2005;38(1)

20 Seavey Part D: Lead related crime

If we accept the premise that the observed decline in crime is the result of the decline in lead intoxication, we can roughly quantify the amount of crime associated with lead intoxication by comparing the curves for the historical declines in lead and crime, and by projecting them forward from 1993 and 2000, respectively. (See Figure on page 17.)

Projecting the lead level decline on a straight line, it reaches zero by the beginning of 2004. This is an analytically useful end point, even if lead levels will more likely taper off on a curve to a steady state reflecting more or less permanent levels of environmental pollution. The crime decline is projected beyond 2000 along a straight line following its 9-year trend. Note that at the point in time where the straight-line projection for lead reaches zero, the crime rate is still at about 3,365 per 100,000, down from its 1991 peak near 5,900.a

It is thus estimated that by 2004, with blood lead reduced to minimal levels, we will still have 57% of our 1991 peak crime level. It follows that less than half of the 1991 peak level of crime can be attributed to lead intoxication. Alternatively, we would have to hypothesize that relatively low levels of lead generate disproportionately large amounts of crime, and that the relationship between lead levels and crime is extremely non-linear, to a degree that we have seen no reason to suspect.

DISCUSSION

The data show a consistent association between water fluoridation and high crime levels. The traditional socio-cultural determinants of crime—poverty, crowded cities, broken homes, drug use, gangs, and the like—have not been analyzed here as confounding factors, so a causal role for fluorides in crime has not been definitively proven, nor has the role of fluorides been quantitatively established vis-à-vis these other factors. And while conclusions about the statistical significance of findings in Part B remain tentative, all the data nevertheless point in the same disturbing direction, raising serious questions as to whether water fluoridation could possibly be as “safe and effective” as public health authorities and dentists have claimed it to be.

The information on sodium fluoride—despite the small sample—is of particular interest, since sodium fluoride, unlike the silicofluorides, shows little association with elevated blood lead levels.9 It thus appears that sodium fluoride may be associated with crime independently of lead. If sodium fluoride—a salt which dissociates into sodium and fluoride ions in water—is associated with crime independently of a role in the uptake of lead, given that sodium is a normal and well-regulated feature of the human system, it follows that the fluoride ions must be the factor associated with the crime. It then follows that, even in the case of the silicofluorides, the fluoride ions must themselves be contributing to crime

aNote that these rates include larceny and theft, in addition to the six major crimes reported on elsewhere in this paper, so the total rates are higher and cannot be compared to the aggregate rates for the six major crimes reported by MQP.

Fluoride 2005;38(1)

Water fluoridation and crime in America 21 independently of silicofluoride’s role in the uptake of lead. Bear in mind that these crime statistics are from the year 2000, when environmental lead had been significantly reduced, and that while the MQP crime data are for the year 2000, the data from the Fluoridation Census are from 1992. The latter are less recent, obviously, but they are the most recent readily available data.

Chemical exposures clearly affect brain function and behavior: lead and mercury are well documented in this regard, and fluorides are gradually becoming better understood. Chemically based crime causality, however, seems to be of a qualitatively different order from the traditionally-accepted types of socio-cultural crime causality. The relationship between these broad categories of causality needs further study, and perhaps a new paradigm is needed to integrate them into a coherent theory.

If the history of lead is any example, however, there may be reason for optimism. Unlike the seemingly intractable socio-cultural determinants, chemical exposures may be amenable to long-term change.

Crime is a measure of social dysfunction, and a barometer for socio-economic dislocation and change. Its causes are infinitely varied in their particulars, nebulous in their totality, and they vary historically from one era to the next. The historical context at any given time, moreover, cannot be duplicated experimentally, challenging the use of scientific methods; and the data that are available to us tend to be colored to some extent by the preoccupations and motives of the era and the people that produced it. There is thus an evident need for an interdisciplinary approach to crime, and for a paradigm which integrates chemistry, statistics, sociology, and history, at a minimum.

The post-Civil War era, for example, saw a significant rise in American crime rates.20 The war may have inured the population to violence; the post-war westward expansion may have created a less-well-ordered frontier society; or those frontiers may have included numerous areas with high fluoride levels in the groundwater—three competing explanations which would doubtless challenge the available data. And while the data in this study focus on the United States during the 1990’s, there are nearby anomalies such as unfluoridated Vancouver, British Columbia., which has experienced high crime rates associated with gangs, drugs, immigration, and ethnic conflict. Immigration, migration, and relocation create difficulties in tracking exposure to fluorides. In the United States, the Clean Air Act (1970) did not address airborne fluorides at all, so we have virtually no data for evaluating exposures from this source.

The senseless multiple shooting became the signature crime of the 1990’s in the United States. Fluoride exposures in many areas may have passed a threshold beyond which “fluoride-related crime” became common. Saturation of Americans with fluorides, via public water supplies, continues to expand. I think we can currently discern the resultant crime effects due to their locational variations. If water fluoridation were ended, it might take a generation for the effects to recede. If it continues to expand, the “signal” identified in this study may get lost in the “noise” of endemic violence.

Fluoride 2005;38(1)

22 Seavey

ACKNOWLEDGEMENT

The author wishes to thank Phyllis Mullenix for pointing out Grandjean’s article. I would also like to thank Prof Burgstahler for his help in organizing this material, and Dr Spittle for his patience in formatting and typesetting it.

REFERENCES

  • . 1  Grandjean P, Juel K, Jensen OM. Mortality and cancer morbidity after heavy occupational fluoride exposure. Am J Epidemiol 1985;121:57-64. 

  • . 2  Li XS, Zhi JL, Gao RO. Effect of fluoride exposure on intelligence in children. Fluoride 1995;28(4):189-192. 

  • . 3  Zhao LB, Liang GH, Zhang DN, Wu XR. Effect of a high fluoride water supply on children’s intelligence. Fluoride 1996;29(4):190-2. 

  • . 4  Xiang Q, Liang Y, Chen L, Wang C, Chen B, Chen X, et al. Effect of fluoride in drinking water on children’s intelligence. Fluoride 2003;36(2):84-94. 

  • . 5  Varner JA, Horvath WJ, Huie CW, Naslund HR, Isaacson RL. Chronic aluminum fluoride adminstration: I. Behavioral observations. Behav Neural Biol 1994;61:233-41. 

  • . 6  Varner JA, Jensen KF, Horvath W, Isaacson RL. Chronic administration of aluminum-fluoride or sodium-fluoride toratsindrinkingwater:alterationsinneuronalandcerebrovascularintegrity. Brain Res 1998;784:284-98. 

  • . 7  Mullenix PJ, Denbesten PK, Schunior A, Kernan WJ. Neurotoxicity of sodium fluoride in rats. Neurotoxicol Teratol 1995;17(2):169-77. 

  • . 8  Needleman HL, Gunnoe C, Leviton A, Reed R, Peresie H, Maher C, et.al. Deficits in psychologic and classroom performance of children with elevated dentine lead levels. N Eng J Med 1979;300: 689-95. 

  • . 9  Masters RD, Coplan MJ. Water treatment with silicofluorides and lead toxicity. Int J Environ Stud 1999; 56:435-49. 

  • . 10  Masters RD, Coplan M. A dynamic, multifactorial model of alcohol, drug abuse, and crime: linking neuroscience and behavior to toxicology. Soc Sci Information 1999; 38:591-624. 

  • . 11  Morgan KO, Morgan S, editors. City Crime Rankings. 8th ed. Lawrence, KS: Morgan Quitno Press; 2001. p. 1-5. 

  • . 12  8th Annual safest cities award. [database on the Internet]. Lawrence, KS: Morgan Quitno Press; c2001 – [cited 2001]. Originally available from: http://www.statestats.com/cit02.safe.html. This URL is no longer available. An updated version is available at Morgan Quinto Press [homepage on the Internet] from http://www.morganquinto.com/. 

  • . 13  Morgan KO, Morgan S, editors. City Crime Rankings. 8th ed. Lawrence, KS: Morgan Quitno Press; 2001. p. 214-5, 226-7, 246-7, 262-3, 294-5, 236-7. 

  • . 14  Kitman JL. The secret history of lead. The Nation. 2000 Mar 20:11-44. p. 37. 

  • . 15  Pirkle JL, Brody DJ, Gunter EW, Kramer RA, Paschal DC, Flegal KM, et. al. The decline in blood 

lead levels in the United States: the National Health and Nutrition Examination Surveys

(NHANES). JAMA 1994 July 27;272(4):284-91.

  • . 16  U.S. Department of Health and Human Services, Public Health Service, Centers for Disease

    Control and Prevention. Update: blood lead levels – United States, 1991-1994. MMWR Morb

    Mortal Wkly Rep 1997 Feb 21;46(7):141-6. 

  • . 17  Morgan KO, Morgan S, editors. City Crime Rankings. 8th ed. Lawrence, KS: Morgan Quitno

    Press; 2001. p. 394-5. 

  • . 18  Moore DS, McCabe GP. Introduction to the Practice of Statistics. 3rd ed. New York: WH Freeman;

    1999. p. 507-12, Table D, p. T-11. 

  • . 19  Moore DS, McCabe GP. Introduction to the Practice of Statistics. 3rd ed. New York: WH Freeman;

    1999. p. 624-32, Table F, p. T-20. 

  • . 20  Pearl M. The Dante club. New York: Random House; 2004. p. 376.

    Published by the International Society for Fluoride Research http://homepages.ihug.co.nz/~spittle/fluoride-journal.htm

    Editorial Office: 727 Brighton Road, Ocean View, Dunedin 9051, New Zealand 

Fluoride 2005;38(1)

MORE LINKS ON THE SAME TOPIC:  ↓ ↓

THE TOXIC METAL CONNECTION by B. Windham

Neurodegenerative Changes in Different Regions of Brain, Spinal Cord and Sciatic Nerve of Rats Treated with Sodium Fluoride

blue line

ASSESSMENT OF GROUNDWATER QUALITY WITH SPECIAL REFERENCE TO FLUORIDE AND ITS IMPACT ON IQ OF SCHOOLCHILDREN IN SIX VILLAGES OF THE MUNDRA REGION, KACHCHH, GUJARAT, INDIA

blue line

Joining_the_Dots_on_Australian_Fluoridation_Fraud

blue line

fluoridation-queensland-logo

new-devider-fq beaks-dont-need-fluoride-f

Of the 400 children born every year in Mount Isa, about 11 %
according to the last blood lead study, have a blood lead
level in excess of the current acceptable guidelines.

Pb-divider-ss

Lead-At-Mount-Isa-s

Map-of-queensland

“…There are about 400 children born every year in Mount Isa
and about 11 per cent of those children, according to the last blood lead
study, have a blood lead level in excess of the current acceptable guideline value…”

The Environmental Protection Agency states on their website that exposure to lead in water that is being consumed above the action level, or 15 parts per Billion, can result in delays in physical and mental development in children, anemia, and muscle problems. In adults, it can cause increases in blood pressure and, eventually with heavy exposure, the development of kidney problems or nerve disorders.

Lead-IQ-

  http://www.naturalnews.com/033122_garden_hoses_lead.html#ixzz1TusKP1ey  

http://www.sonic.net/kryptox/environ/lead/romans.htm

http://fluoride-class-action.com/hhs/comments-re-lead

 LEAD IN ANCIENT ROME

LEAD IN AVIATION FUEL

FLUORIDATION AND LEAD CONTAMINATION

Pb-divider-ss

F.-Mullenix-comment-s

INTELLECTUAL SUPPRESSION

Brian-Martin

❝ … Most environmental scientists are afraid to take a public stand if it means appearing to challenge powerful corporations, governments or professions. They are afraid of what top officials in their organisation may think and do. They are aware of legislation which prohibits them from speaking to the media about their work without permission. They are afraid that they might be blocked from promotion, shunted to less interesting work, or even dismissed…

Pb-divider-ss

“As is normal, the solution to pollution is dilution.
You poison everyone a little bit rather than poison a few people a lot.
This way, people don’t know what’s going on.”

Pb-divider-ss

fluoridation-queensland-logo

new-devider-fq

7704d57a00f4d8802b5296134c4eb5c8


Two chemicals H2SiF6 and Na2SiF6, jointly called “silicofluorides”
are used to treat public water supplies of 140 million Americans even
though, the EPA has admitted, they have never been tested for safety.

rodger-d-master-f

www.dartmouth.edu/~rmasters

Roger D. Masters – Research Professor

-Nelson A. Rockefeller Professor of Government, Emeritus Dartmouth College

Abstract:

Toxic metals like lead, manganese, copper and cadmium damage neurons
and deregulate neurotransmitters like serotonin and dopamine
which are essential to normal impulse control and learning.

Earlier studies show that — controlling for socio-economic and demographic factors — environmental pollution with lead is a highly significant risk factor in predicting higher rates of crime, attention deficit disorder or hyperactivity, and learning disabilities.

Exposure and uptake of lead has been associated with industrial pollution, leaded paint and plumbing systems in old housing, lead residues in soil, dietary habits (such as shortages of calcium and iron), and demographic factors (such as poverty, stress, and minority ethnicity). We report here on an additional “risk co-factor” making lead and other toxic metals in the environment more dangerous to local residents: the use of silicofluorides as agents in water treatment. The two chemicals in question — fluosilicic acid and sodium silicofluoride — are toxins that, despite claims to the contrary, do not dissociate completely and change water chemistry when used under normal water treatment practices. As a result, water treatment with siliconfluorides apparently functions to increase the cellular uptake of lead. Data from lead screening of over 280,000 children in Massachusetts indicates that silicofluoride usage is associated with significant increases in average lead in children’s blood as well as percentage of children with blood lead in excess of 10μg/dL. Consistent with the hypothesized role of silicofluorides as enhancing uptake of lead whatever the source of exposure, children are especially at risk for higher blood lead in those communities with more old housing or lead in excess of 15 ppb in first draw water samples where silicofluorides are also in use. Preliminary findings from county-level data in Georgia confirm that silicofluoride usage is associated with higher levels of lead in children’s blood. In both Massachusetts and Georgia, moreover, behaviors associated with lead nurotoxicity are more frequent in communities using silicofluorides than in comparable localities that do not use these chemicals. Because there has been insufficient animal or human testing of silicofluoride treated water, further study of the effect of silicofluorides is needed to clarify the extent to which these chemicals are risk co-factors for lead uptake and the hazardous effects it produces.

Keywords: Lead; toxicity; pollution; children’s health; public water supplies

-.-.-.-.-.-.-.-.-.-.-.-

A Primer for Policymakers and Public Policy Advocates
(Westport: Praeger, 2003), pp. 23-56.

ABSTRACT:

It is impossible to deny that a revolution in neuroscience and other areas of biology has taken place over the last half-century.  The  estimates of 83 million Americans taking drugs like Prozac for depression and 11 million children on Ritalin for hyperactivity indicate it is time to reconsider the role of brain chemistry in social behavior and violent behavior.  Since it is obvious that loss of impulse control can contribute to violent outbursts – and evidence shows that some toxic chemicals (such as lead) can have this effect, it is time to consider neuroscientific evidence linking environmental toxins and rates of violent behavior.  To illustrate the implications of the new issues involved, I focus on a hitherto unexplored example.  Two chemicals (H2SiF6 and Na2SiF6, jointly called “silicofluorides” or SiFs) are used to treat public water supplies of 140 million Americans even though, as the EPA has admitted, they never been tested for safety.  To illustrate the interdisciplinary complexities entailed when linking brain chemistry to policy decisions concerning violent crime, our argument has four main stages: first, why might SiFs be dangerous? Second, what biochemical effects of SiF could have toxic consequences for humans?  Third, on this basis a research hypothesis is formulated to measure the types of harm.  In this case, we predict children in communities using SiF should have increased uptake of lead from environmental sources and higher rates of behavioral dysfunctions such as hyperactivity (ADHD) known to be caused by lead neurotoxicity.  Finally, the hypothesis is tested using multiple sources of data including rates of violent crime studied using a variety of multivariate statistical techniques (including analysis of variance, multiple regression, and stepwise regression).  As this outline should make clear, a combination of interdisciplinary perspectives and great prudence is needed to link research in neuroscience to policies concerning violent crime,  If confirmed, however, the potential benefits of hypotheses like the one tested below may be great, revealing the generally unsuspected value of including neuroscientific research in the analysis of human social behavior.

Requests for reprints and correspondence should be directed to: Prof. Roger D. Masters, Department of Government, HB 6222, Dartmouth College, Hanover, NH 03755. Email: Roger.D.Masters@Dartmouth.edu

.-.-.-.-.-.-.-.-.-.

The full version of the above is on the net,
and as the above suggests adding silicofluorides
to drinking water amounts to domestic terrorism.

Black Lines separate

see also: http://www.waterloowatch.com/hydrofluorosilicic%20acid.html

see also:  www.navigatingtheaether.com/…/the-dangers-of-fluoride-conspiracy..

fluoridation-queensland-logo

new-devider-fq

2-purple-parrots-f

This is a hot issue – cover-up and denial is the ADA’s only option,
given 
the serious implications of  fluoridation on millions
of kidneys both
 human and animal (pets) and
the corrosion of 
infrastructure.

eagles-comment-f

american flag

F.blood lead : Afican Am. ss

Afican Americans f

At present, U.S. public water systems serving over 140 million people are fluoridated with
200,000 tons of commercial grade hydrofluosilicic acid (H2SiF6) and sodium
silicofluoride (Na2SiF6), together called “silicofluorides” (or “SiFs”).

.
Data from numerous studies show that, taking economic, social and racial factors into account,
where silicofluorides are used, children absorb more lead from the environment, and there
are higher rates of diseases and behavioral problems associated with lead poisoning
(including hyperactivity, substance abuse, and violent crime)
.

Although some early studies showed differences between sodium fluoride and sodium silicofluoride, to this day the substitution of silicofluorides in public water treatment facilities HAS NEVER BEEN SUBJECTED TO APPROPRIATE ANIMAL OR HUMAN TESTING. Recently, the Assistant Administrator of the EPA admitted to Congress that his agency had no data on SiF toxicity and the Chief of the Treatment Technology Evaluation Branch at the National Risk Management Research Laboratory confirmed that the EPA has “no” data on the “health and behavioral effects of fluosilicic acid.”

Despite claims of safety by oral health officials, laboratory research in Germany revealed that silicofluorides do not dissociate completely and have important biological effects. To follow up on this issue, we have compared children’s blood lead levels in communities using SiF treated water with communities using sodium fluoride or with non-fluoridated water. In three separate samples, totaling over 400,000 children, SiF treated municipal water is ALWAYS significantly associated with increased blood lead levels in children.

This effect was evident in a Massachusetts survey of lead levels in 280,000 children (see graph for children exposed to SiF from the Greater Boston water system, from towns that add SiF locally, or from communities using sodium fluoride, and towns without fluoridation). For the state of New York, data was available on venous blood lead levels for 151,225 children in communities of 15,000 to 75,000. Controlling for other factors associated with higher blood lead, silicofluorides were again significantly associated with higher uptake of lead from the environment. For black children, who are especially at risk for high blood lead, those in towns using SiF were less likely to have low blood lead and more likely to have lead over 10µg/dL. To confirm that these results are not due to other socio-economic or demographic factors, additional statistical tests were run.

The third study concerned children’s blood lead levels in the National Health and Nutrition Evaluation Survey (NHANES III), which had reports for 7224 children from 80 counties with populations over 500,000. Since only 4 of these counties had any communities that used sodium fluoride, analysis of the NHANES III data focused on the percentage of the entire county population exposed to silicofluoride treated water.

Among the 1543 children of all ages from large urban counties with over 80% of the population exposed to fluoridation (almost all of whom receive water treated with SiF), average blood lead was 5.12 µg/dL whereas the average for 1139 children in low fluoride exposure counties was 3.64 µg/dL Blood lead in the 473 children sampled from the medium fluoridation counties was 3.23 µg/dL, which was significantly different from the high fluoridation counties but not from either low fluoridation counties or those with unknown fluoridation status, where average blood lead levels were 3.16 µg/dL (S.D. 2.83). Controlling for the Poverty, the effect of SiF use was highly significant (p < .0001). When the sample is divided by age and race, these findings provide six separate samples in which SiF is associated with high blood lead (see Graphs).

In all three populations studied, those children in each racial category and each age group who were highly likely to be exposed to silicofluorides differ strongly in levels of blood lead from those not exposed.

This conclusion was further checked by analyzing available data for health and behavioral traits that have been associated with high blood lead (such as violent crimes, cocaine use and asthma). In each case, those exposed to silicofluoride treated water were more likely to have behavioral or health problems that are more likely among those with high lead in their bodies.

The injection of silicofluorides in public water supplies is a practice whose elimination could possibly contribute to reduced rates of learning disabilities, substance abuse, violent crime, and asthma (all connected with lead poisoning and other toxins). Whatever the benefits to teeth (and this is highly controversial), our research shows that the issues facing the public concern silicofluoride chemistry, toxicology, and the linkage of neurotoxins with behavior or health. Before SiF chemicals are used, citizens must know that they are safe for all.

Dury & Young F.

Indigenous A ss

“Close The Gap”

close-the-gap-f

 Fluoridation and Renal Disease in Aboriginal and Torres Strait Islanders

– – – – – – – – – – – – – – – – – – —– «<◊>» —– – – – – – – – – – – – – – – – – – – 

anesthesiology-logo

 Fluoride Ion Toxicity in Human Kidney Collecting Duct Cells

– – – – – – – – – – – – – – —– «<◊>» —– – – – – – – – – – – – – – – 

PEOPLE WITH KIDNEY IMPAIRMENT ARE AT GREATER RISK FROM FLUORIDES
Indigenous Australians have smaller kidneys than non-indigenous Australians
a reduced number of nephrons and decreased renal reserve –
(Singh G, White A, Spencer J, Wang Z, Hoy W [1999]).

genocidal

Qld. Indigenous Water Fluoridated -Bamaga

Native australian devider

Inorganic fluoride. Divergent effects
on human proximal tubular cell viability.
R. A. Zager and M. Iwata. Fred Hutchinson Cancer Research Center, Seattle.
Inorganic fluoride. Divergent effects on human proximal tubular cell …

Native australian devider

Two Shi Lancan flags

We visited the affected villages with the medical team comprising
Dr. Tilak Abeyesekera 
and Dr. Nimmi Athureliye
where positive CKDU patients were identified.

Fluoride, Cadmium, Arsenic- Renal Failure – Sri Lanka – Prof. Oliver A. Ileperuma

Native australian devider

image-of-kidneyNational Kidney Foundation

There is consistent evidence that impairment of kidney function
results in changes to the way in which fluoride is metabolized and
eliminated 
from the body, resulting in an increased burden of fluoride.

Native australian devider

Indian flag

Impairment of Kidney Function – INDIA

Kidneys are among the most sensitive body organs in their histopathologial
and functional responses to excessive amounts of fluoride.
They are the primary organs concerned with
excretion and retention of fluoride…

 – – – – – – —– «<◊>» —– – – – – – –

THE UNIVERSITY OF BURDWAN BURDWAN-713104
WEST BENGAL, INDIA 

fluorosis-10-year-olds-india-f

“FLUORIDE POLLUTION AND ITS EFFECT ON WATER AND
VEGETATION IN BIRBHUM DISTRICT, WEST BENGAL”

See thesis below   detailed diagrams + more photos.

thesis 

by

KARTICK CHANDRA PAL, M.Sc. (Chem)

We thank you  for such a mammoth undertaking.

bioacumulation

– – – – – – – – – – – – – –  – –  «<◊>»  – – – – – – – – – – – – – – – – –

More info on Fluoride in India → HERE

– – – – – – – – –  «<◊>»  – – – – – – – – – –

image-hospita-patiala

Endemic Fluorosis Patiala – 1962

– – – – – – –  «<◊>»  – – – – – – – –

Infants Warning on Fluoridation – American Dental Association

↑  New York – 13 November  2006 ↑ 
To prevent tooth damage, the American Dental Association (ADA)
warned its members that fluoridated water should
not be mixed into concentrated formula
or foods intended for babies
one year and younger…

[ Exposure to Fluorides while teeth are forming
will result in visual damage – dental fluorosis.
This would be a bad look for fluoridation.
]

– – –  «<◊>»  – – – –

 See also 
Dartmouth Researcher Warns of Chemicals Added to Drinking Water

we-are-all-in-this-f-together

Fluoridation Queensland Logo

new-devider-fq